It is safe to say that the broad market has picked up on this good news, bad news trend out of Europe, and I believe many traders have placed their bets against this market, banking that there will be more bad news from Europe in the coming days. While it is true that the European issues are still likely unsolved, in the short-run the herd is still too bearish.
Market sentiment is a great indicator of future market movements. When everyone is bearish, you can usually be fairly certain that the market is near a bottom. When everyone is bullish, it’s usually advisable to scale back on your long positions.
Like I previously mentioned, we had an enormous short squeeze late last week, and many traders are still adding to their short positions today.
The short-term trading herd continues to fight the tape, even as many of your market leaders are breaking out. Apple Inc is approaching 600, XOM and CVX are just a few points off their 52 week highs. WFC is within a point of its 52 week high. Visa Inc. made a new all time high today. There are many stocks powering forward.
There is an old trading adage, “The trend is your friend”, and the trend from the past three trading sessions is decidedly higher.
]]>* For more information on the HFT tractor beam, see CFA magazine – The HFT Tractor Beam.
]]>However, traders should use caution when following Mr. Buffett because his investing style is certainly not for everyone. Although a majority of Mr. Buffett’s investments have worked out handsomely, some of them did so because of his deep pockets and often preferred investor status. For example, when Mr. Buffett stepped up to the plate in Goldman Sachs (NYSE:GS) in September of 2008, he did so with preferred stock that had a juicy 10% dividend and warrants to buy $5 billion worth of common stock at $115 a share, $10 below Goldman’s share price when the deal was announced. But just a few months later Warren was down significantly on this investment as on November 21, 2008 GS traded as low as $47.41/share. Most individual traders cannot afford to lose that kind of money on a trade, especially if they trade on margin. But Warren has very deep pockets and can therefore take more heat than the average trader can.
Mr. Buffett’s investment in General Electric (NYSE:GE) in 2008 was accompanied with preferred status as well. He received preferred stock with a 10% annual dividend and warrants to buy GE common at $22.25/share. Any trader that followed his strategy and bought similar long term warrants in October 2008 has yet to see any gains from those warrants, as GE has only traded up to 21.65 since that date. But Mr. Buffett is long out of the trade as GE has redeemed his preferred stock giving Buffett a nice profit despite his warrants being out of the money. If any trader had interpreted Buffett’s purchase as a buying indicator for GE stock, they would have been under serious water five months later as the stock traded as low as 5.73 in March of 2009. Again, most traders do not have deep enough pockets to take that kind of heat.
Which brings us to Buffett’s recently highly publicized investment in Bank of America (NYSE:BAC). Once again, he received preferred stock at a 6% annual dividend and warrants at 7.14 (in the money as of today). When the news hit the tape of his purchase, BAC shares spiked up to 8.80, only to fall under 5.00 by the end of year. It once again takes deep pockets to be able to stomach those losses.
Mr. Buffett rarely discusses the risk parameters associated with his investments, although he does employ diversification in his investment strategies. Unfortunately, the average investor does not get the “sweet” deals and must have a modicum of risk management.
Deep pockets also gives Buffett the luxury of adding to a losing position. This is something a trader should never do. Although many traders have reaped large profits from this mor-on strategy (put more and more on as it goes against you) there is larger amount of retail and proprietary traders who have been destroyed doing this. Therefore, it is of paramount importance as traders to have your risk parameters well defined. Using some type of mental stop is critical in protecting one’s trading account. Chances are if the trade goes against you and you are stopped out, you may have another chance to get back in, and most likely at a more favorable price than your original entry price.
The bottom line is that if you do not have access to the “sweet deals” and do not have deep pockets, you must incorporate sound risk-management skills into your trading style. So if you are following Buffett’s purchase in GM today, make sure you have a contingency plan in place if the trade moves against you. By employing sound risk management into your trading, you’ll be a better trader and one day you may have deep pockets like Warren Buffett.
]]>
*charts courtesy of Neovest
Yes that’s right you are reading the quote correctly. The spread was 37 cents. 100 shares x 100 shares. Looks pretty thick and deep to me. And why does the quote change so many times in the one second increment that I have shown? HFT liquidity providers change their quotes continuously in that 1 second increment, usually trying to aggressively penny each other, but then cancelling their orders simultaneously.
So if I wanted to sell my 500 shares at the market, I could be filled on one hundred shares at 203.10, and pay that 37 cent spread. And on the last 400 shares, who knows where I would be filled.
But this is just an isolated quote isn’t it? Guess again. Here is the quote two minutes later. It’s actually a penny wider, 38 cents.
But it does gets better, and the spread does tighten up. 11 minutes into the trading day the spread is now a tight 27 cents.
Well IBM is a $200 stock so of course the spread is going to be wider. This isn’t the case with other DOW components is it? No they are indeed tighter.
Proctor & Gamble (PG) had a nice tight spread of 21 cents, 19 seconds after the open.
Coke (KO) had an 11 cent spread, in the first 30 seconds of trade.
Then tightened to a 10 cent spread, 100 shares x 100 shares 2 minutes after the open.
MMM had a cool 25 cents spread after the open.
These are supposed to be some of the most liquid stocks on our exchanges. Where is all this liquidity that our academic scholars claim the market has?
Well if you analyze spreads in the middle of the day, you will get an entirely different picture.
If you bring up the IBM quote in the middle of the day, you will typically find the spread to be only a few cents. Coke and P&G will usually have a 1 cent spread Why is this? HFT liquidity providers do not like risk, and when there is so much uncertainty of where the price is going (like when the stocks open, or right before market moving events), they simply do not quote aggressively. Many HFT programs don’t quote at all.
Nanex showed images of the E-mini liquidity around a 10:00 economic number release on April 19th. http://www.nanex.net/aqck/3233.html They call it a liquidity vacuum, as HFT participants cancel their orders ahead of the number.
Was this lack of liquidity an isolated event today? Hardly. This is a daily occurrence. I would challenge all our academic scholars who analyze spreads to take a good look at liquidity a few minutes after the open, or around any type of market impact event such as a 10:00 economic news release. You’ll find liquidity to be very thin and very dispersed. Indeed, we have plenty of liquidity in the market, just not during periods of market uncertainty.
Update: We’d like to thank Nanex for taking the time to post liquidity charts of the stocks mentioned in this article:
]]>
http://www.youtube.com/watch?v=a3qUQCUKDm4
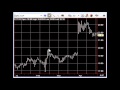
Your answer is a large sell imbalance was posted by the NYSE at 3:45 pm ET. These sell imbalances are published every day at this time, and sometimes they can have a major influence on the price of the stock.
The designated market maker (DMM) on the floor of the NYSE continuously logs all the buy MOC (market on close) orders, and all the sell MOC orders, on their security. And then at 3:45 PM ET, this information is disseminated to the market. (It is a good idea to check with your data provider, to make sure they carry the imbalance feed).
Large buy imbalances will typically press the stock higher, where large sell imbalances will typically press the stock lower.
In the IBM example, traders subscribing to the imbalance feed, seen the sell imbalance at 3:45, and then began selling the stock, with the expectation that the closing MOC sell orders would press the stock lower. It worked perfectly in the case of IBM today, as the stock gapped down on the closing print.
It is not always that simple however. In this HFT world, many algorithmic systems will manipulate these closing imbalances, and sometimes in the last minute or two they will flip, causing a sell imbalance to go to a buy imbalance. If that happens it catches many imbalance traders by surprise.
Sometimes these imbalance plays get crowded as well. And if too many imbalance players are on the same side of the trade, the imbalance could also flip.
In any regard, funny things happen after 3:45 in NYSE issues, and if you don’t subscribe to the imbalance feeds, you might be missing some pretty important information.
Therefore, stocks that have had a good quarter, often have a good couple of days at the end of the quarter as fund managers accumulate positions in those issues. For example, take Coke (KO), it has had crazy buy imbalances at the end of the close the last two days, probably due to some institutional investors trying to accumulate stock. It very well may have a large buy imbalance again today for the same reason, this would press a stock like KO higher into the close. Overall, since the entire quarter has been very strong, there could be some significant accumulation in a number of issues at the end of the day today.
These gains are typically short lived, as these stocks will often give back their gains in the following week or two. In any regard, if stocks do rally into the close, it may be a good idea to lighten up on some of your longs.